Aspect based sentiment analysis
Taste, Aroma, Palate or Appearance?
To answer our first question regarding the beer aspects most important to consumers,
we conduct aspect-based sentiment analysis or ABSA. We do this by conducting
an observational study between "absolute winner" and "absolute loser" beers,
which we'll explain in a bit. Before that, we have to introduce a preprocessing step.
Considering that numerical ratings don't convey proper information about users' attitude
towards a beer, we give our BEERT model the context (one of the four beer aspects) and it
provides us with positive/neutral/negative sentiment scores for each aspect from the textual
review. The scores are in the [0,1] interval and sum up to 1. Since we want to determine if a
certain sentiment of an aspect exists, we convert each sentiment score to indicators by setting
up a threshold and comparing them to it. What's more, as we look for aspects with a strong sentiment,
our goal is to have only one of the three aspect-specific indicators present (which means that this
sentiment is dominant) or to have them all being zero (we are not certain that the sentiment is
polar enough). To be very confident in our results, we set up a threshold of 0.9.
Note that, due to BEERT's performance being computationaly expensive, we're
working with a subset of our BeerAdvocate data - we keep only the reviews with
fewer than 2000 words. Even with this approach, BEERT needed around 60h to extract the sentiments.
Our observational study compares two groups of beers: absolute winner, with all numerical aspect ratings greater than an absolute loser beer. We want to investigate how does each aspect sentiment derived from text influence the overall rating. Therefore, we randomly match pairs of better and worse beers, but we have to be careful in this process and try to eliminate as many confounders as possible that might endanger our analysis. Matched beer reviews:
In total, we are working with around 62k of matched reviews.
Let’s take a look at the following plot (Figure 3), depicting the number of positive/neutral/negative
and the total number of sentiment indicators for each aspect of winner and loser beers. We can immediately notice
that people are more expressive about beers they rated higher simply by looking at bar heights.
But, a more important result is that Aroma and Taste clearly stand out – people have more polarized
opinions when writing about these two aspects.
Figure 3 : Number of indicators per aspect per sentiment
This could not be concluded merely by looking at the numerical
ratings on eCDF plot (Figure 4) for each aspect of winner beers – it seems that people grade all aspects similarly
(halo effect seen in real life :))
Figure 4 : eCDF of aspect ratings for absolute winner
It would also be interesting to see if some aspect sentiments are prevalent in winner beers. To investigate this, we estimate the average difference and 95% confidence intervals for the difference in sentiment indicators between winner and loser beers for each aspect. We then visualize the results in Figure 5. For positive sentiments, all C.I.s are above zero, and for negative, all are below zero. But, this result isn’t that interesting – it’s expected that the positive sentiment is prevalent in winners, while the negative is prevalent in losers. What’s interesting is the intensity of the influence of aspect sentiments on respective beer groups. Let’s look at positive indicators – clearly, Aroma and Taste stand out compared to the other two. But what does this mean? Imagine an edge case when all winners have a positive indicator for an aspect “1” and all losers have “0”. This would mean we can only look at that specific aspect and tell if a beer is a winner or a loser, regardless of the numerical ratings. Well, Aroma and Taste are the closest to that edge case, so we conclude that they have the strongest influence on better-rated beers. Similarly, negative Taste sentiment is the best indicator of a beer being rated lower.
Figure 5 : Confidence intervals for differences of aspects
The two analyses we conducted above both confirm that Aroma and Taste are prevalent in winner reviews compared to Appearance and Palate. We, therefore, deduct that these two are most influential on the ratings, and even though people often give similar grades to all aspects, they mostly care about Aroma and Taste.
Keywords
What do you like about the beer?
Keywords and beer styles
Figure 6 : Number of reviews for the most rated styles
To answer our question, we start by investigating which style-specific
keywords extracted from review text correlate with a high rating.
We call these overall keywords. For each style, we take the top-100 most
frequent words in all reviews of that style from which stopwords are excluded.
Now, similarly to ABSA, we construct binary indicators for each keyword, denoting
its presence in each style-specific review. To see how each keyword influences
the grades, we conduct linear regression with Rating (an aggregate of
numerical aspect grades) as the target and indicators as covariates. Finally,
we obtain overall keywords as those whose coefficients we are certain in
(p-value < 0.05) and for which the change in Rating is greater than 0.1
when having it in the formula.
Let’s visualize the results we got:
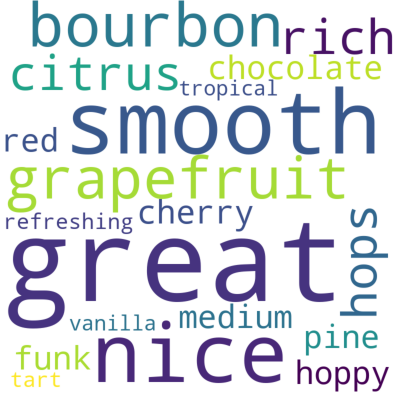
The size of a keyword corresponds with the number of styles it is associated with. It’s not shocking
that generic words like great and nice appear in reviews the most often; we extract real information
from overall keywords relating to a specific aspect :
where green-colored words have contribute positively to the Rating, and red-colored negatively.
In the interactive plot below (Figure 7), you can click on any of the 15 beer
styles observed and visualize the contribution of each overall keyword to the style’s Rating.
Note that the p-values for regression coefficients are all less than 10-39.
Figure 7 : Keywords and coefficients per style
Based on this analysis, we derive the following conclusions:
Seasonal keywords
Overall keywords provided us with a global insight into how different beer style characteristics
influence its rating. However, looking at Figure 8 depicting the monthly trend in Ratings
for each of our 15 styles, we notice that the grades vary greatly depending on the period.
For example, “American Amber/Red Ale” is rated 0.1 higher on average in February than in August.
This inspired us to look for style-specific seasonal keywords to find out
when is which beer characteristics important for consumers.
Figure 8 : Monthly trends of Rating per style
We decided to introduce seasonality by observing the best and worst rated month for each beer style.
As in the previous analysis, we extract top-100 most frequent words and discard stopwords, but now only
based on reviews given in these two months. Our candidates for seasonal keywords are ones that appear
10% more in one of these months – only they have the possibility to make a difference in ratings.
Finally, as before, we convert them to binary indicators, fit a linear regression on all the reviews
for a specific style, and decide which become seasonal keywords by looking at their p-values and
contributions to the Rating. All kept regressor coefficients have p-values less than 10-28.
Our method yielded 13 seasonal keywords (presented in the word cloud below). We already
see the impact of the seasonal analysis – 7 new style-specific keywords, which were not
present in the set of overall keywords, emerged. Out of these 13, only the word caramel
has a negative influence on one style – “American Double / Imperial IPA”. This style is
best rated on average in February and worst in July, which can be explained by the fact
that the word caramel is more frequent in reviews given in July. Let’s now take a
look at the words vanilla and fresh/refreshing, all influencing multiple beer
styles positively. Our results show that vanilla-noted beers are more appreciated
during changing seasons and the least during summer. On the other hand, people
like a refreshing beer when it's warmer outside, as most of worst rated months
of influenced styles are during winter.
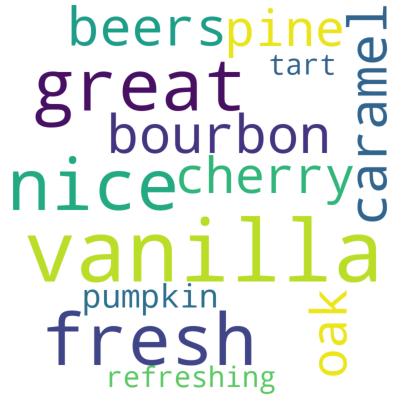
Table of coefficients for seasonal keywords:
vanilla:
| Style | Coefficient | Min Month | Max Month |
|---|---|---|---|
| American Double / Imperial Stout | 0.116201 | 9 | 4 |
| Russian Imperial Stout | 0.135693 | 8 | 5 |
| American Strong Ale | 0.145952 | 9 | 11 |
fresh/refreshing:
| Style | Coefficient | Min Month | Max Month |
|---|---|---|---|
| American IPA | 0.135115 | 7 | 10 |
| Witbier | 0.168595 | 12 | 9 |
| American Pale Ale (APA) | 0.186084 | 1 | 10 |
caramel:
| Style | Coefficient | Min Month | Max Month |
|---|---|---|---|
| American Double / Imperial IPA | -0.118599 | 7 | 2 |
To conclude, let’s ask ourselves why seasonal keywords shed a “different” light on beer aspects when compared to overall keywords.
Well, overall keywords represent a general trend of mentioned beer characteristics, ones that are likely to increase or
decrease the rating given at any point in time. Reviewers will probably be satisfied or dissatisfied with a particular style
characteristic whenever they drink it. However, there exist some keywords that are not mentioned very frequently but their relative usage
varies noticeably through time. That's exactly what we observed in previous analysis.
Conclusion
Which beer aspects are the most important for users?
If we were lazy, we could’ve simply looked at all the numerical ratings of our reviews and conclude – people like all aspects equally and give their grades correspondingly. Luckily, our high school Psychology course finally paid off and our doubt was awakened. With the help of an observational study and users’ opinions, we found out that Taste and Aroma are what they write and care about primarily. So breweries, listen carefully: if you mix the ingredients just right, your work will probably pay off!
What keywords do reviewers use when giving good grades?
For all those who are still not convinced, take a look at the words people use when describing most popular beer types – almost all are related to Taste and Aroma, and in a positive way! (Shoutout to linear regression for making this possible). Again, breweries, don’t make your palate too thin, put extra grapefruit in your IPA, and add some aroma richness to your stout. But be careful, you should avoid sweet caramel notes during summer; people want to be refreshed!
The team
Dubravka Kutlesic
Computer Science
Aleksa Milisavljevic
Computer Science
Lazar Radojevic
Computer Science
Luka Radic
Electrical Engineering